panthema / tags / coding_tricks

Weblog Articles Tagged with '#coding tricks'

Weblog Articles

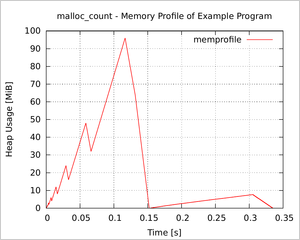
Memory profile plot as generated by example in malloc_count tarball

Released malloc_count 0.7 - Tools for Runtime Memory Usage Analysis and Profiling

Posted on 2013-03-16 22:17 by Timo Bingmann at Permlink with 1 Comments. Tags: #c++ #coding tricks

This post announces the first version of malloc_count, a very useful tool that I have been fine-tuning in the past months. The code library provides facilities to

  • measure the current and peak heap memory allocation, and
  • write a memory profile for plotting.
  • Furthermore, separate stack_count function can measure stack usage.

The code tool works by intercepting the standard malloc(), free(), etc functions. Thus no changes are necessary to the inspected source code.

See the malloc_count project page for more information about version 0.7.


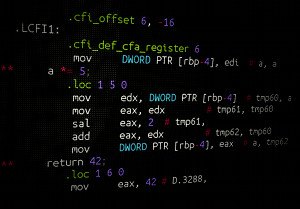
Instacode coloring of assembler code

Coding Tricks 101: How to Save the Assembler Code Generated by GCC

Posted on 2013-01-24 18:07 by Timo Bingmann at Permlink with 2 Comments. Tags: #c++ #coding tricks #frontpage

This is the first issue of a series of blog posts about some Linux coding tricks I have collected in the last few years.

Folklore says that compilers are among the most complex computer programs written today. They incorporate many optimization algorithms, inline functions and fold constant expressions; all without changing output, correctness or side effects of the code. If you think about it, the work gcc, llvm and other compilers do is really amazing and mostly works just great.

Sometimes, however, you want to know exactly what a compiler does with your C/C++ code. Most straight-forward questions can be answered using a debugger. However, if you want to verify whether the compiler really applies those optimizations to your program, that your intuition expects it to do, then a debugger is usually not useful, because optimized programs can look very different from the original. Some example questions are:

  • Is a local integer variable stored in a register and how long does it exist?
  • Does the compiler use special instructions for a simple copy loop?
  • Are special conditional instructions used for an if or switch statement?
  • Is a specific function inlined or called each time?

These questions can be answered definitely by investigating the compiler's output. On the Net, there are multiple "online compilers," which can visualize the assembler output of popular compilers for small pieces of code: see the "GCC Explorer" or "C/C++ to Assembly v2". However, for inspecting parts of a larger project, these tools are unusable, because the interesting pieces are embedded in much larger source files.

Luckily, gcc does not output binary machine code directly. Instead, it internally writes assembler code, which then is translated by as into binary machine code (actually, gcc creates more intermediate structures). This internal assembler code can be outputted to a file, with some annotation to make it easier to read.
This article continues on the next page ...

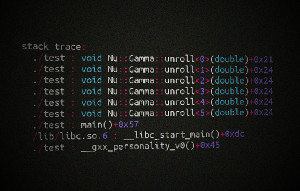
Instacode coloring of stacktrace

C++ Code Snippet - Print Stack Backtrace Programmatically with Demangled Function Names

Posted on 2008-09-01 22:30 by Timo Bingmann at Permlink with 35 Comments. Tags: #c++ #code-snippet #coding tricks #frontpage

Yesterday I was tasked to analyzed an inner function of a reasonably complex software package. The inner function was called thousands of times from many different parts of the program, a simple counter print-out showed that. However I was interested in which execution paths reach this inner function and how often the different parts access the function.

My straight-forward idea was to dump a stack backtrace each time the inner function is called, similar to the one printed by a debugger. However I needed some code snippet to dump the stack backtrace programmatically, without using gdb to halt the program each time.

Stack backtraces can be saved with backtrace(3), resolved into symbolic names using backtrace_symbols(3) and printed using backtrace_symbols_fd(3). These functions are well documented and fairly easy to use.

However I was debugging a C++ program, which made heavy use of templates and classes. C++ symbols names (including namespace, class and parameters) are mangled by the compiler into plain text symbols: e.g. the function N::A<int>::B::func(int) becomes the symbol _ZN1N1AIiE1B4funcEi. This makes the standard backtrace output very unreadable for C++ programs.

To demangle these strings the GNU libstdc++ library (integrated into the GNU Compiler Collection) provides a function called __cxa_demangle(). Combined with backtrace(3) a pretty stack backtrace can be outputted. The demangling function only works for programs compiled with g++.

The following header file contains a function print_stacktrace(), which uses backtrace(3), backtrace_symbols(3) and __cxa_demangle() to print a readable C++ stack backtrace.

This article continues on the next page ...