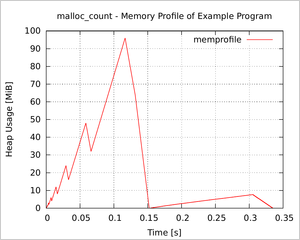
Released malloc_count 0.7 - Tools for Runtime Memory Usage Analysis and Profiling
Posted on 2013-03-16 22:17 by Timo Bingmann at Permlink with 1 Comments. Tags: #c++ #coding tricks
This post announces the first version of malloc_count, a very useful tool that I have been fine-tuning in the past months. The code library provides facilities to
- measure the current and peak heap memory allocation, and
- write a memory profile for plotting.
- Furthermore, separate
stack_countfunction can measure stack usage.
The code tool works by intercepting the standard malloc(), free(), etc functions. Thus no changes are necessary to the inspected source code.
See the malloc_count project page for more information about version 0.7.

yes, it's very nice.............................