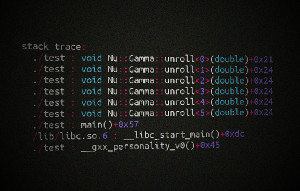
C++ Code Snippet - Print Stack Backtrace Programmatically with Demangled Function Names
Posted on 2008-09-01 22:30 by Timo Bingmann at Permlink with 35 Comments. Tags: #c++ #code-snippet #coding tricks #frontpage
Yesterday I was tasked to analyzed an inner function of a reasonably complex software package. The inner function was called thousands of times from many different parts of the program, a simple counter print-out showed that. However I was interested in which execution paths reach this inner function and how often the different parts access the function.
My straight-forward idea was to dump a stack backtrace each time the inner function is called, similar to the one printed by a debugger. However I needed some code snippet to dump the stack backtrace programmatically, without using gdb to halt the program each time.
Stack backtraces can be saved with backtrace(3), resolved into symbolic names using backtrace_symbols(3) and printed using backtrace_symbols_fd(3). These functions are well documented and fairly easy to use.
However I was debugging a C++ program, which made heavy use of templates and classes. C++ symbols names (including namespace, class and parameters) are mangled by the compiler into plain text symbols: e.g. the function N::A<int>::B::func(int) becomes the symbol _ZN1N1AIiE1B4funcEi. This makes the standard backtrace output very unreadable for C++ programs.
To demangle these strings the GNU libstdc++ library (integrated into the GNU Compiler Collection) provides a function called __cxa_demangle(). Combined with backtrace(3) a pretty stack backtrace can be outputted. The demangling function only works for programs compiled with g++.
The following header file contains a function print_stacktrace(), which uses backtrace(3), backtrace_symbols(3) and __cxa_demangle() to print a readable C++ stack backtrace.
You can freely use it for whatever purpose: download stacktrace.h. I hope you find this utility function useful.
// stacktrace.h (c) 2008, Timo Bingmann from http://idlebox.net/
// published under the WTFPL v2.0

#ifndef _STACKTRACE_H_
#define _STACKTRACE_H_

#include <stdio.h>
#include <stdlib.h>
#include <execinfo.h>
#include <cxxabi.h>

/** Print a demangled stack backtrace of the caller function to FILE* out. */
static inline void print_stacktrace(FILE *out = stderr, unsigned int max_frames = 63)
{
    fprintf(out, "stack trace:\n");

    // storage array for stack trace address data
    void* addrlist[max_frames+1];

    // retrieve current stack addresses
    int addrlen = backtrace(addrlist, sizeof(addrlist) / sizeof(void*));

    if (addrlen == 0) {
	fprintf(out, "  <empty, possibly corrupt>\n");
	return;
    }

    // resolve addresses into strings containing "filename(function+address)",
    // this array must be free()-ed
    char** symbollist = backtrace_symbols(addrlist, addrlen);

    // allocate string which will be filled with the demangled function name
    size_t funcnamesize = 256;
    char* funcname = (char*)malloc(funcnamesize);

    // iterate over the returned symbol lines. skip the first, it is the
    // address of this function.
    for (int i = 1; i < addrlen; i++)
    {
	char *begin_name = 0, *begin_offset = 0, *end_offset = 0;

	// find parentheses and +address offset surrounding the mangled name:
	// ./module(function+0x15c) [0x8048a6d]
	for (char *p = symbollist[i]; *p; ++p)
	{
	    if (*p == '(')
		begin_name = p;
	    else if (*p == '+')
		begin_offset = p;
	    else if (*p == ')' && begin_offset) {
		end_offset = p;
		break;
	    }
	}

	if (begin_name && begin_offset && end_offset
	    && begin_name < begin_offset)
	{
	    *begin_name++ = '\0';
	    *begin_offset++ = '\0';
	    *end_offset = '\0';

	    // mangled name is now in [begin_name, begin_offset) and caller
	    // offset in [begin_offset, end_offset). now apply
	    // __cxa_demangle():

	    int status;
	    char* ret = abi::__cxa_demangle(begin_name,
					    funcname, &funcnamesize, &status);
	    if (status == 0) {
		funcname = ret; // use possibly realloc()-ed string
		fprintf(out, "  %s : %s+%s\n",
			symbollist[i], funcname, begin_offset);
	    }
	    else {
		// demangling failed. Output function name as a C function with
		// no arguments.
		fprintf(out, "  %s : %s()+%s\n",
			symbollist[i], begin_name, begin_offset);
	    }
	}
	else
	{
	    // couldn't parse the line? print the whole line.
	    fprintf(out, "  %s\n", symbollist[i]);
	}
    }

    free(funcname);
    free(symbollist);
}

#endif // _STACKTRACE_H_
To demonstrate the stack trace function I wrote the following small test source code. It calls print_stacktrace() four times from different functions, that were specifically crafted to produce complex names. I left it uncommented, because the functions have no real purpose.
#include "stacktrace.h"
#include <map>

namespace Nu {

template<typename Type>
struct Alpha
{
    struct Beta
    {
	void func() {
	    print_stacktrace();
	}
	void func(Type) {
	    print_stacktrace();
	}
    };
};

struct Gamma
{
    template <int N>
    void unroll(double d) {
	unroll<N-1>(d);
    }
};

template<>
void Gamma::unroll<0>(double) {
    print_stacktrace();
}

} // namespace Nu

int main()
{
    Nu::Alpha<int>::Beta().func(42);
    Nu::Alpha<char*>::Beta().func("42");
    Nu::Alpha< Nu::Alpha< std::map<int, double> > >::Beta().func();
    Nu::Gamma().unroll<5>(42.0);
}
When compiled with g++ -rdynamic -o test test.cc the program prints the following output:
$ ./test
stack trace:
  ./test : Nu::Alpha<int>::Beta::func(int)+0x15
  ./test : main()+0x24
  /lib/libc.so.6 : __libc_start_main()+0xdc
  ./test : __gxx_personality_v0()+0x45
stack trace:
  ./test : Nu::Alpha<char*>::Beta::func(char*)+0x15
  ./test : main()+0x37
  /lib/libc.so.6 : __libc_start_main()+0xdc
  ./test : __gxx_personality_v0()+0x45
stack trace:
  ./test : Nu::Alpha<Nu::Alpha<std::map<int, double, std::less<int>, std::allocator<std::pair<int const, double> > > > >::Beta::func()+0x15
  ./test : main()+0x42
  /lib/libc.so.6 : __libc_start_main()+0xdc
  ./test : __gxx_personality_v0()+0x45
stack trace:
  ./test : void Nu::Gamma::unroll<0>(double)+0x21
  ./test : void Nu::Gamma::unroll<1>(double)+0x24
  ./test : void Nu::Gamma::unroll<2>(double)+0x24
  ./test : void Nu::Gamma::unroll<3>(double)+0x24
  ./test : void Nu::Gamma::unroll<4>(double)+0x24
  ./test : void Nu::Gamma::unroll<5>(double)+0x24
  ./test : main()+0x57
  /lib/libc.so.6 : __libc_start_main()+0xdc
  ./test : __gxx_personality_v0()+0x45
$

Thanks a lot for sharing your code! That was very useful!